
purpleair.api.key=key hereThe default frequency for fetching data is every 15 minutes. This can be changed with a property in repository.properties:
purpleair.frequency=15With the API key specified RAMADDA will periodically access the API for each Purple Air entry you have created and append the current data to a local CSV file in RAMADDA. This file can be downloaded from the sensor entry page. Over time these files can grow to be quite large (depending on the API fetch frequency). The default display only shows the most recent 20000 records. You can clear out the entire file for an sensor entry through the Clear File menu item.
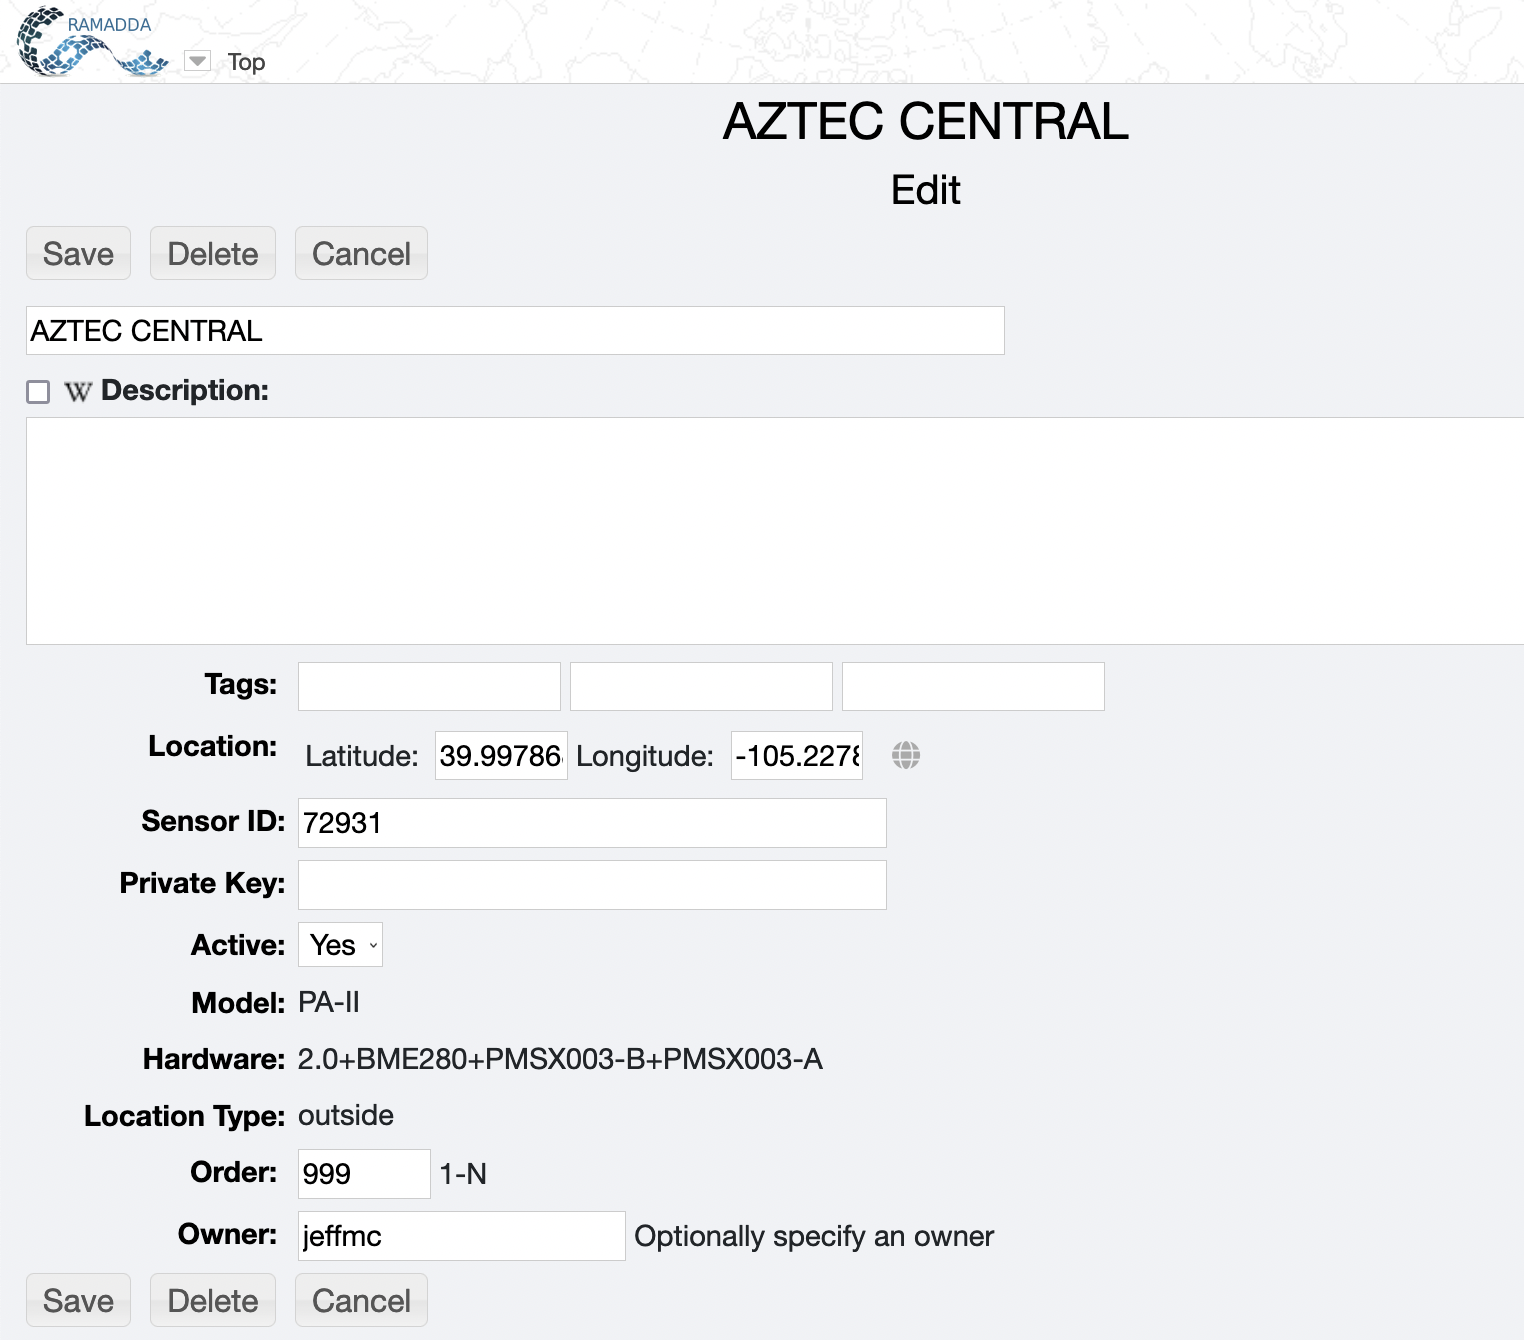
 When a new Purple Air Sensor entry is created RAMADDA will fetch the metadata for the sensor,
e.g. name, location, model, etc. If the sensor is a private sensor you can enter the private
key when creating the entry. The private key is available through your Purple Air account.
You can also add your private key as a RAMADDA property in a .properties file on your
server. Specify your the property ID as the private key in the entry. For example, if you
had a private key "some_private_key" then, in a repository.properties file enter:
When a new Purple Air Sensor entry is created RAMADDA will fetch the metadata for the sensor,
e.g. name, location, model, etc. If the sensor is a private sensor you can enter the private
key when creating the entry. The private key is available through your Purple Air account.
You can also add your private key as a RAMADDA property in a .properties file on your
server. Specify your the property ID as the private key in the entry. For example, if you
had a private key "some_private_key" then, in a repository.properties file enter:
myprivatekey=some_private_keyThe name of the property, e.g., "myprivatekey", is arbitrary. Now, when you create the Purple Air entry in RAMADDA in the private key field just entry "myprivatekey".
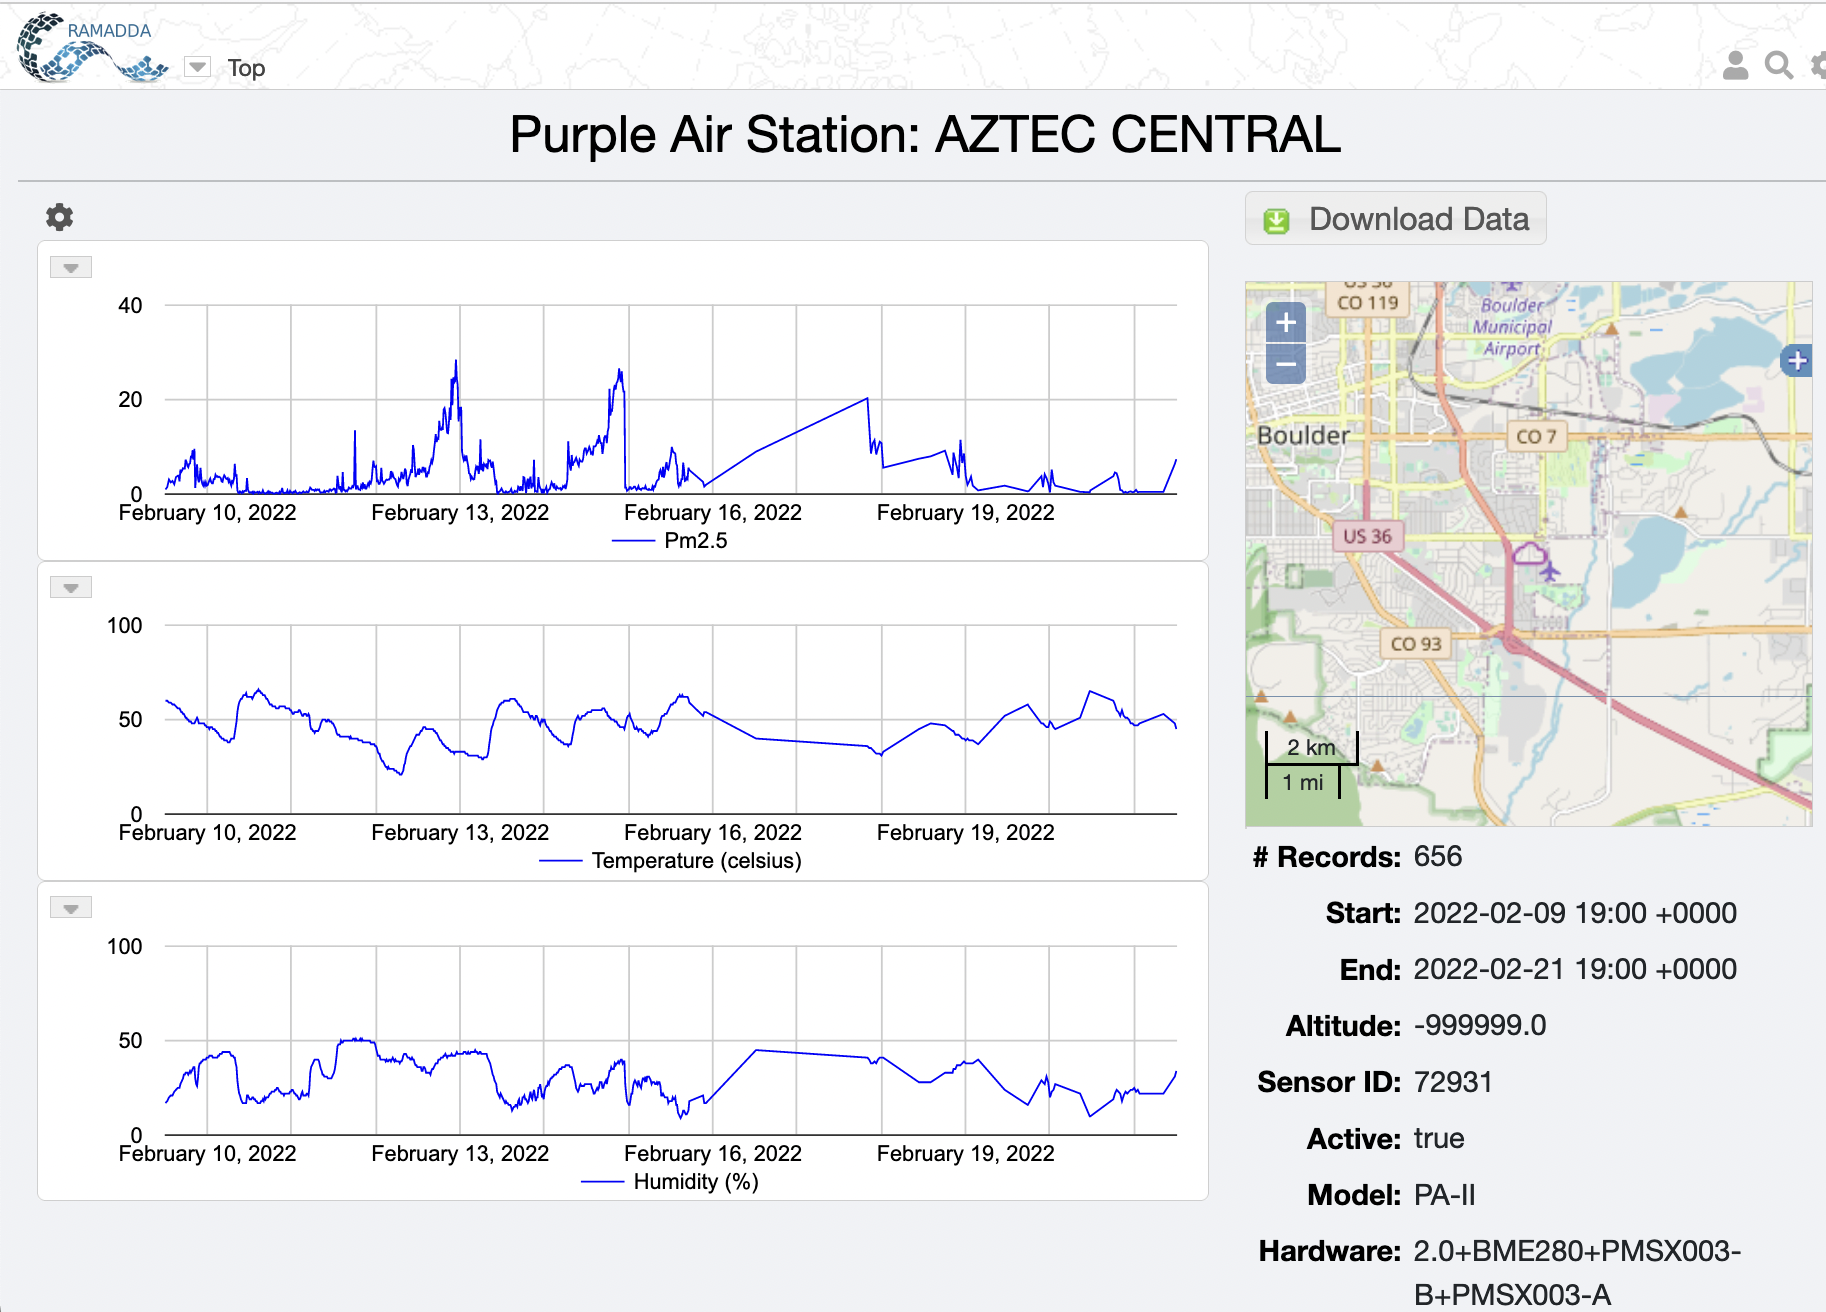
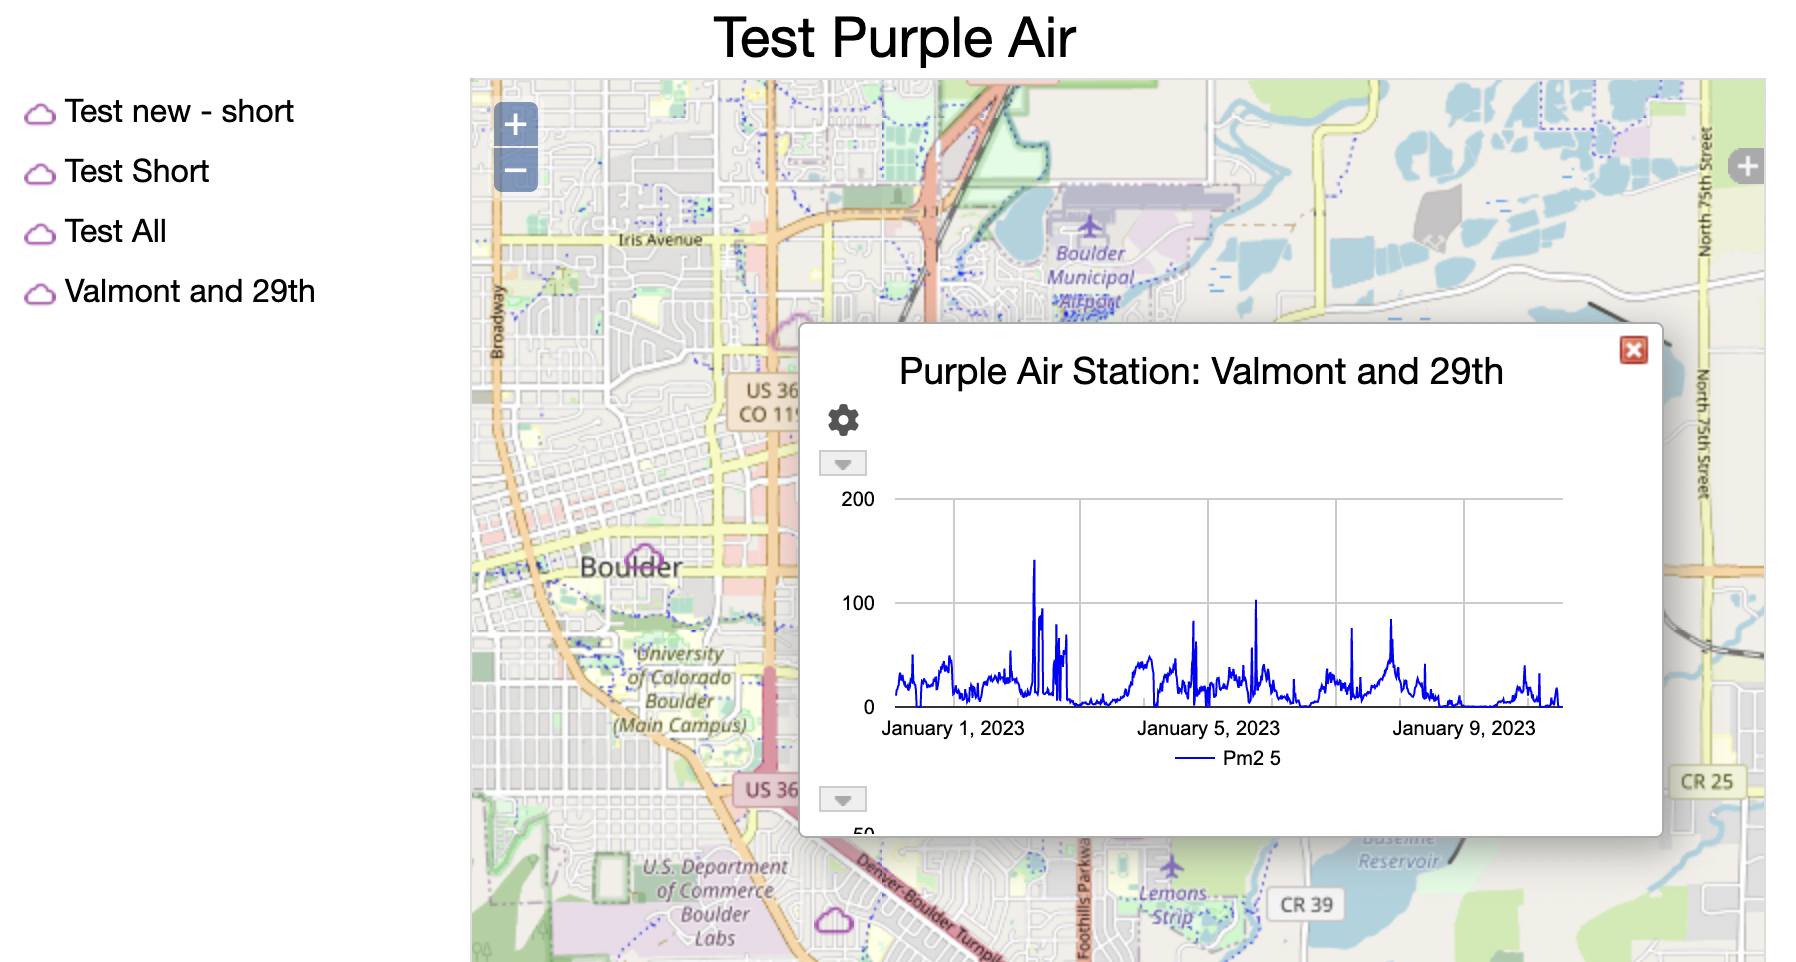
The default display for a Purple Air Sensor entry is shown below. Note, initially there is no data but over time the data will be fetched from the API.
Note: if you change which fields are being collected than the data file that is created
needs to be reset so that the file contains all of the same fields. To do this go the Purple Air
RAMADDA entry and select "Clear File" from the entry menu. This will delete the existing file
and create a new one with the new set of field identifiers.
|
humidity,temperature,pressure,voc,ozone1,pm1.0,pm2.5,pm10.0The short fields are:
  humidity,temperature,pressure,voc,ozone1,pm1.0,pm2.5,pm10.0
  0.3_um_count,0.5_um_count,1.0_um_count,2.5_um_count,5.0_um_count,10.0_um_count
and the all fields include all of the available fields:
humidity, humidity_a, humidity_b
temperature, temperature_a, temperature_b
pressure, pressure_a, pressure_b
voc, voc_a, voc_b
ozone1
analog_input
pm1.0, pm1.0_a, pm1.0_b, pm1.0_atm, pm1.0_atm_a, pm1.0_atm_b
pm1.0_cf_1, pm1.0_cf_1_a, pm1.0_cf_1_b
pm2.5_alt, pm2.5_alt_a, pm2.5_alt_b, pm2.5, pm2.5_a, pm2.5_b
pm2.5_atm, pm2.5_atm_a, pm2.5_atm_b, pm2.5_cf_1, pm2.5_cf_1_a
pm2.5_cf_1_b,pm2.5_10minute, pm2.5_10minute_a, pm2.5_10minute_b
pm2.5_30minute, pm2.5_30minute_a, pm2.5_30minute_b, pm2.5_60minute
pm2.5_60minute_a, pm2.5_60minute_b, pm2.5_6hour, pm2.5_6hour_a
pm2.5_6hour_b, pm2.5_24hour, pm2.5_24hour_a, pm2.5_24hour_b
pm2.5_1week, pm2.5_1week_a, pm2.5_1week_b,pm10.0, pm10.0_a
pm10.0_b, pm10.0_atm, pm10.0_atm_a, pm10.0_atm_b, pm10.0_cf_1
pm10.0_cf_1_a, pm10.0_cf_1_b
scattering_coefficient, scattering_coefficient_a, scattering_coefficient_b
deciviews, deciviews_a, deciviews_b
visual_range, visual_range_a, visual_range_b
0.3_um_count, 0.3_um_count_a, 0.3_um_count_b,
0.5_um_count, 0.5_um_count_a, 0.5_um_count_b
1.0_um_count, 1.0_um_count_a, 1.0_um_count_b
2.5_um_count, 2.5_um_count_a, 2.5_um_count_b
5.0_um_count, 5.0_um_count_a, 5.0_um_count_b
10.0_um_count 10.0_um_count_a, 10.0_um_count_b
 To have the folder just show a map go and edit the folder, click on the "wiki display" checkbox, and enter the below
wiki text.
To have the folder just show a map go and edit the folder, click on the "wiki display" checkbox, and enter the below
wiki text.
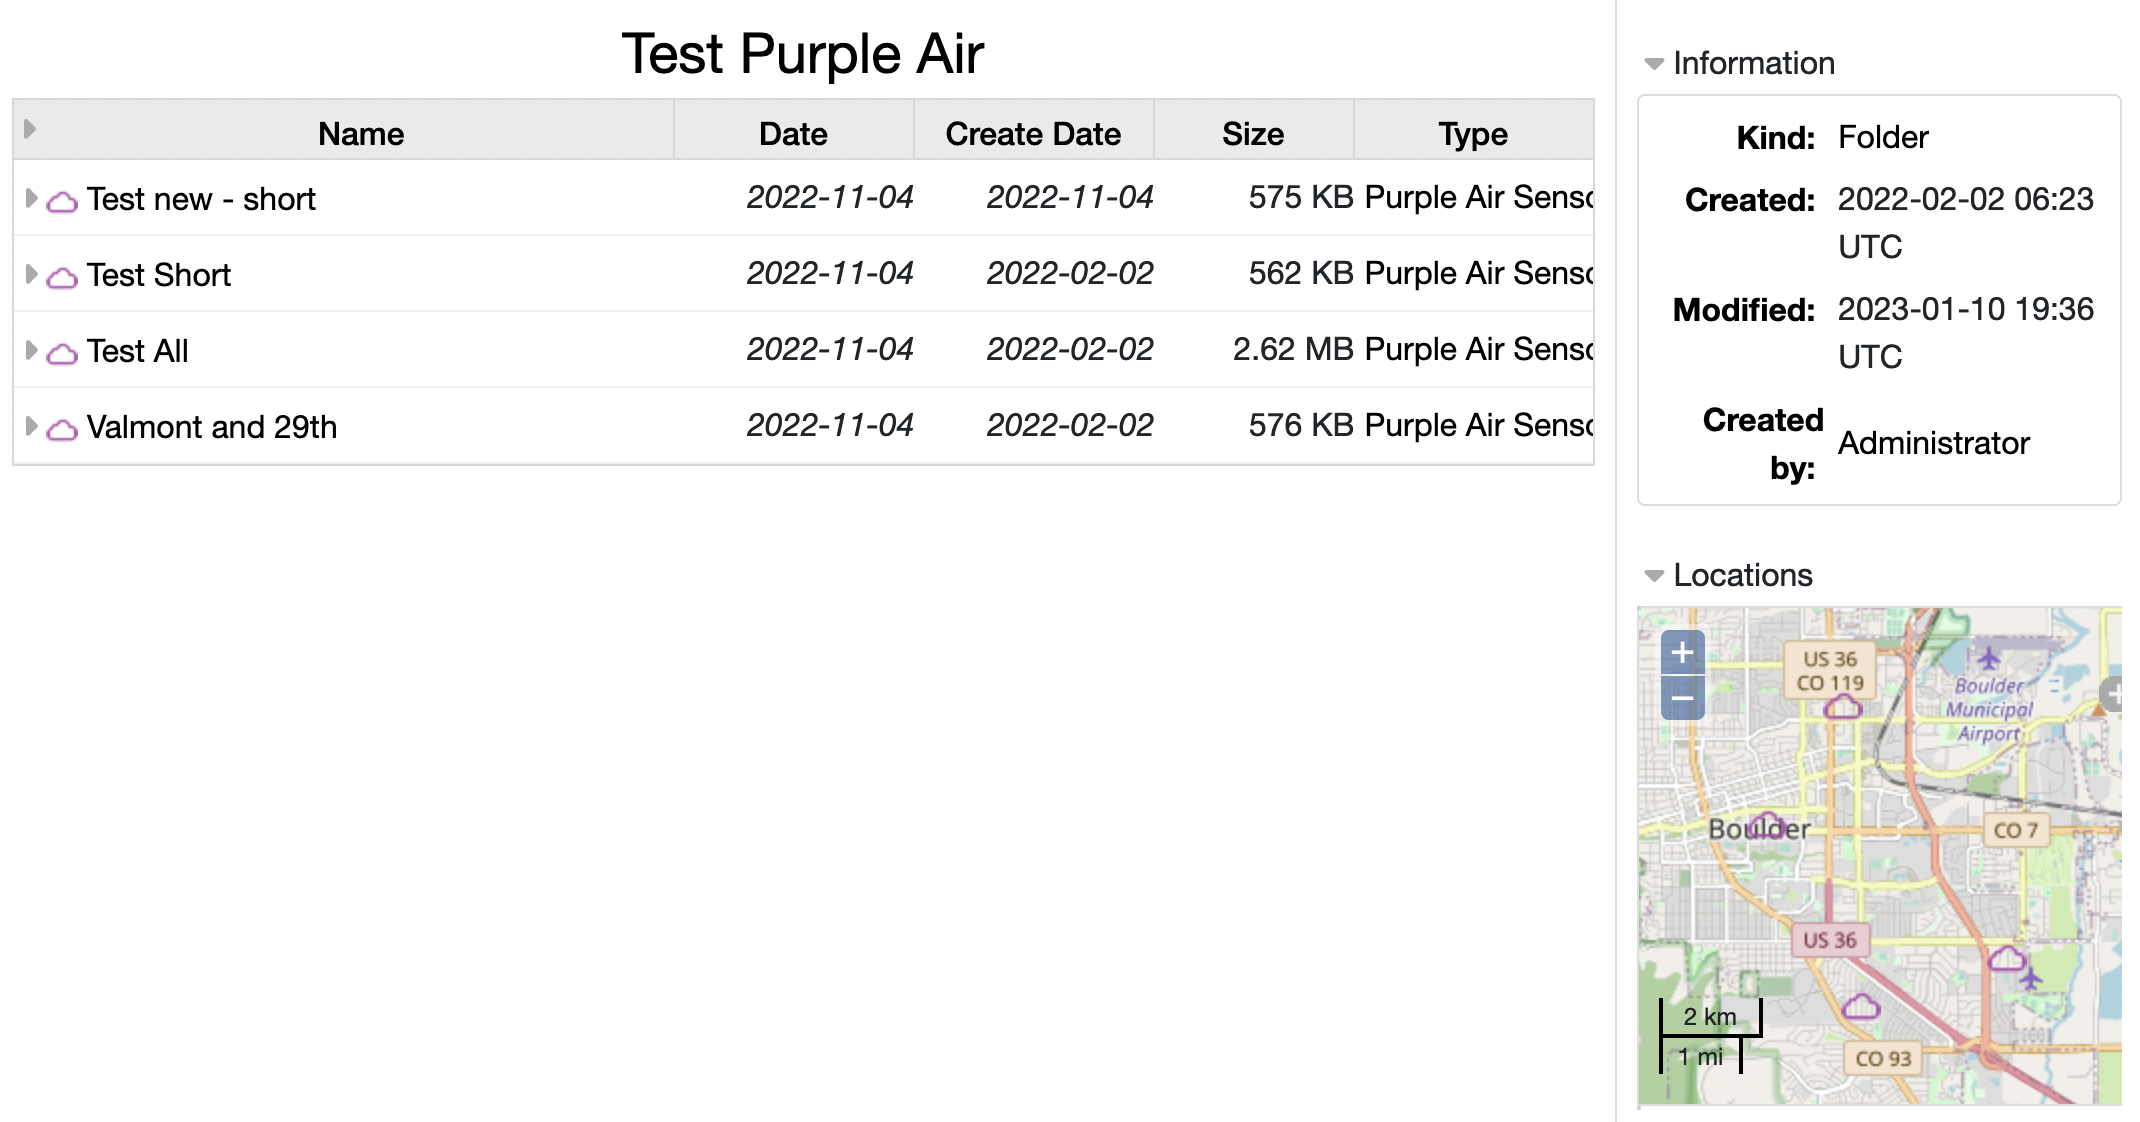
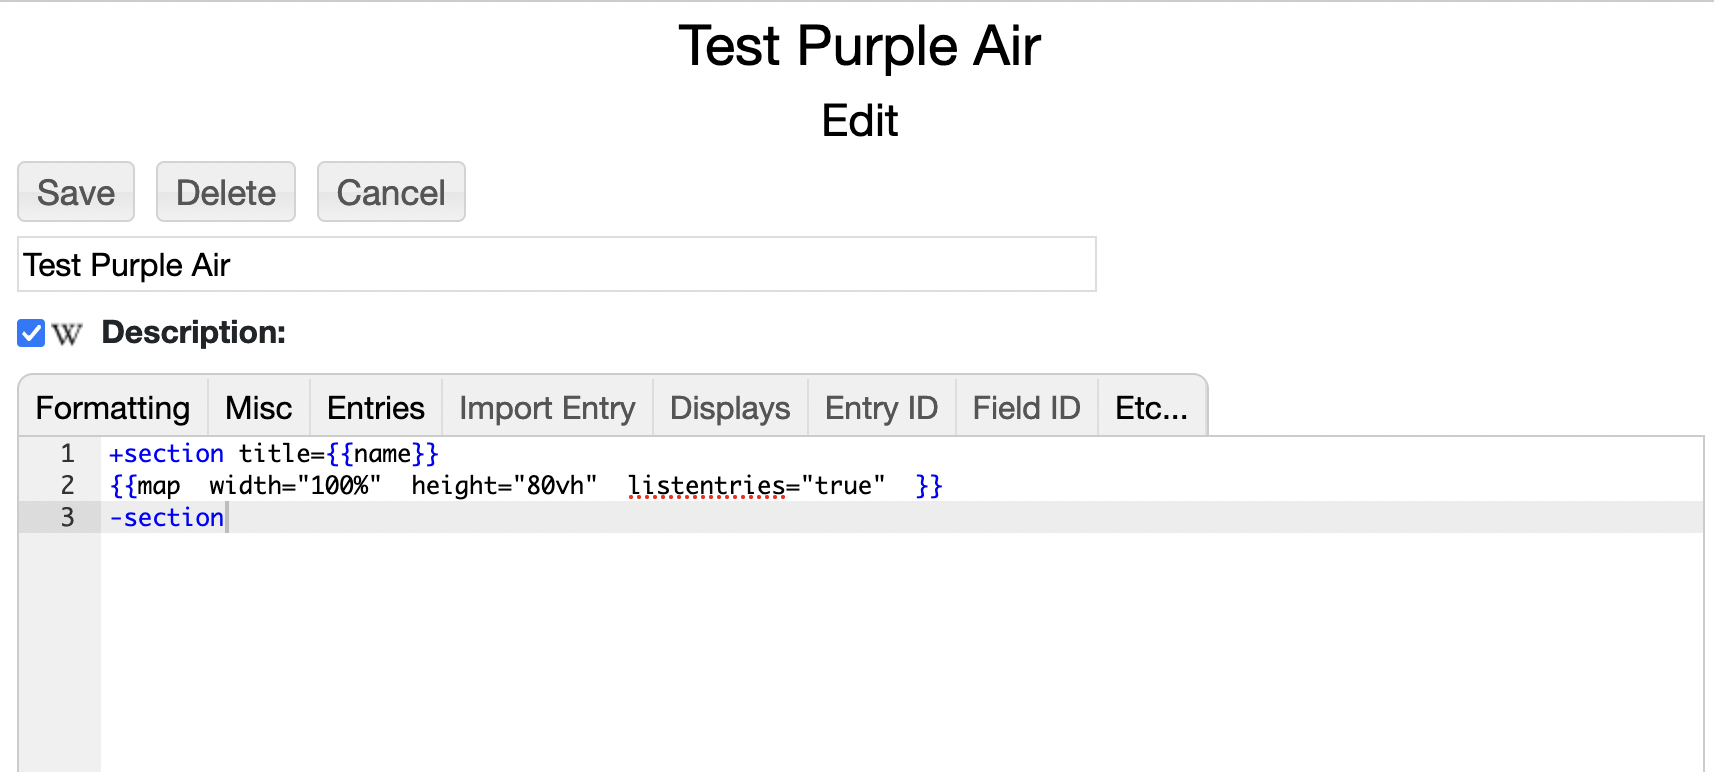 This will give a map view of the children entries:
 A richer map display can be created with the
Integrated Map Data Viewer (IMDV) display component.
In another folder go to the File->Pick a Type... menu and look for "Integrated Map Data"
under the GIS Data list.
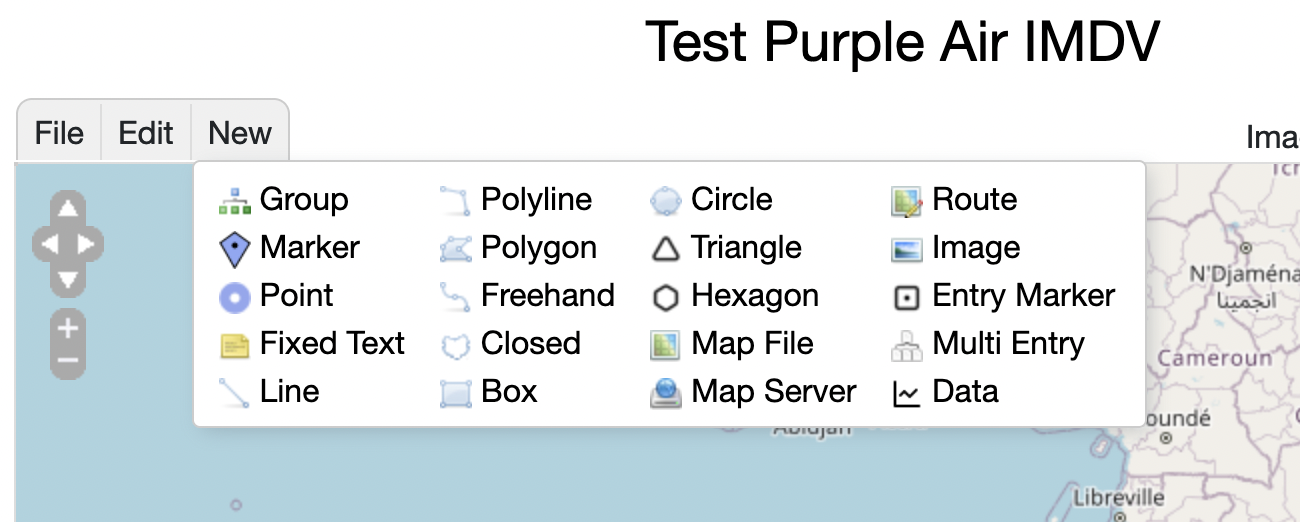
Once created select "Multi Entry" under the New menu:
A richer map display can be created with the
Integrated Map Data Viewer (IMDV) display component.
In another folder go to the File->Pick a Type... menu and look for "Integrated Map Data"
under the GIS Data list.
Once created select "Multi Entry" under the New menu:
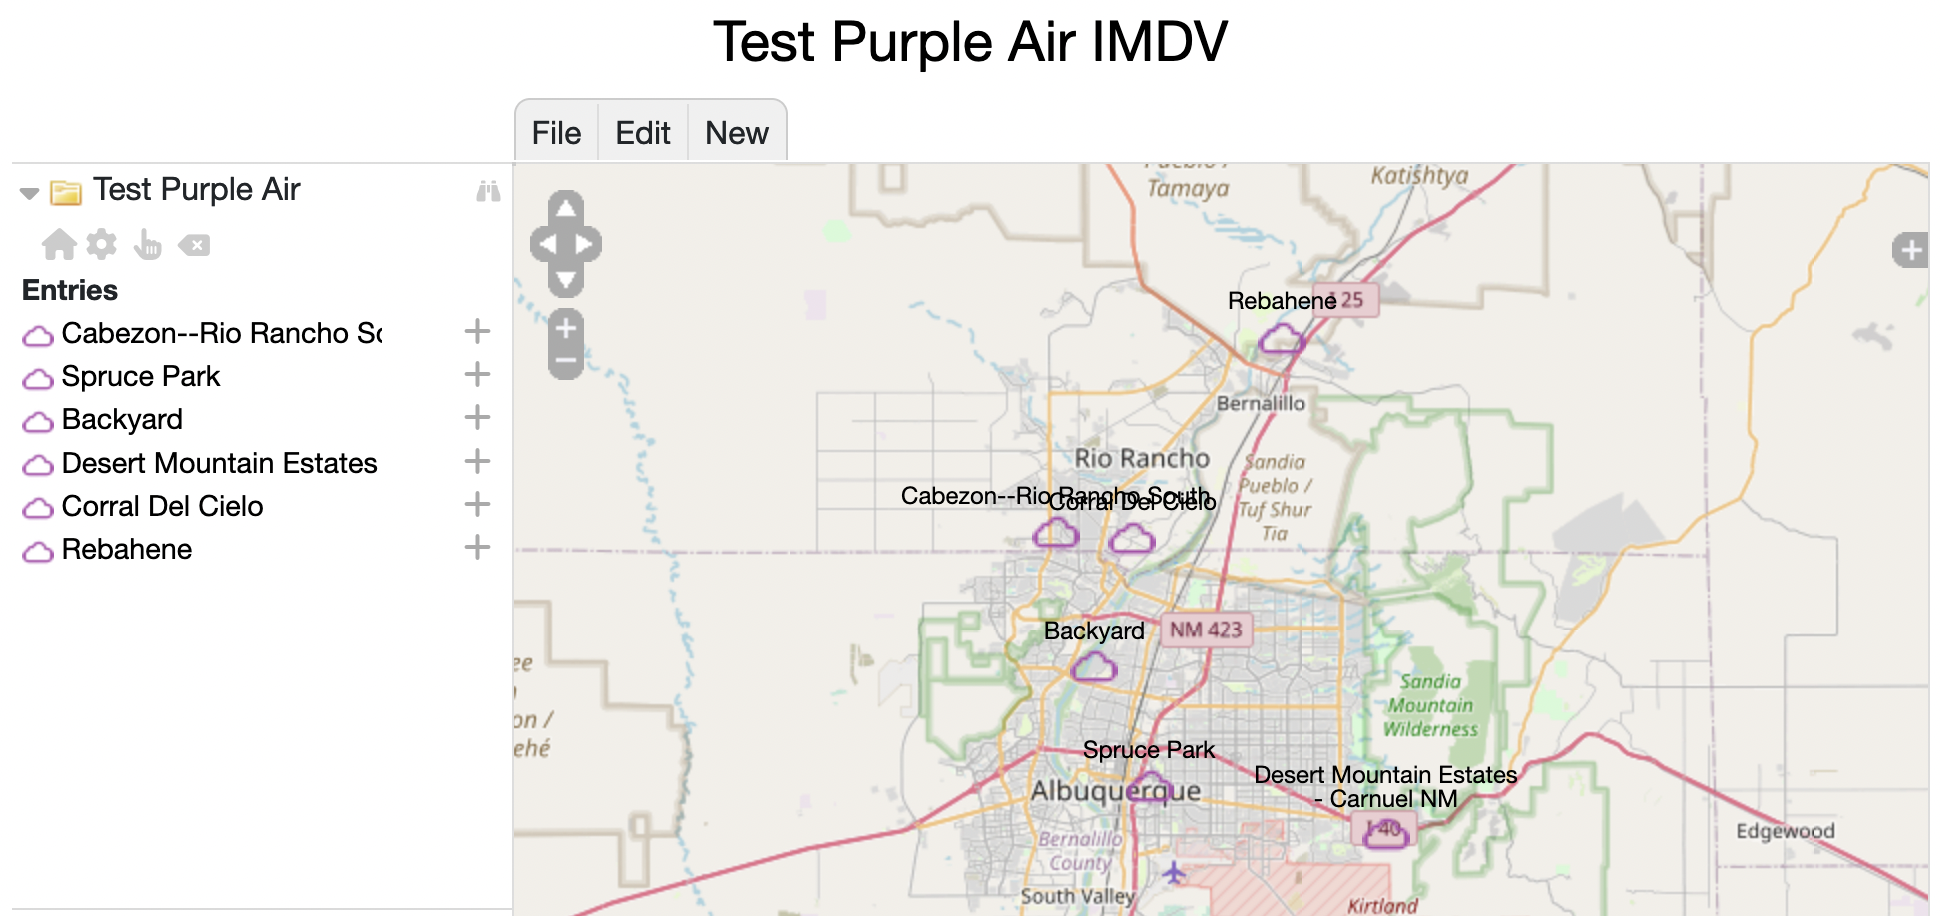
 Choose the folder that holds your Purple Air sensor entries. You should
end up with something like:
Choose the folder that holds your Purple Air sensor entries. You should
end up with something like:
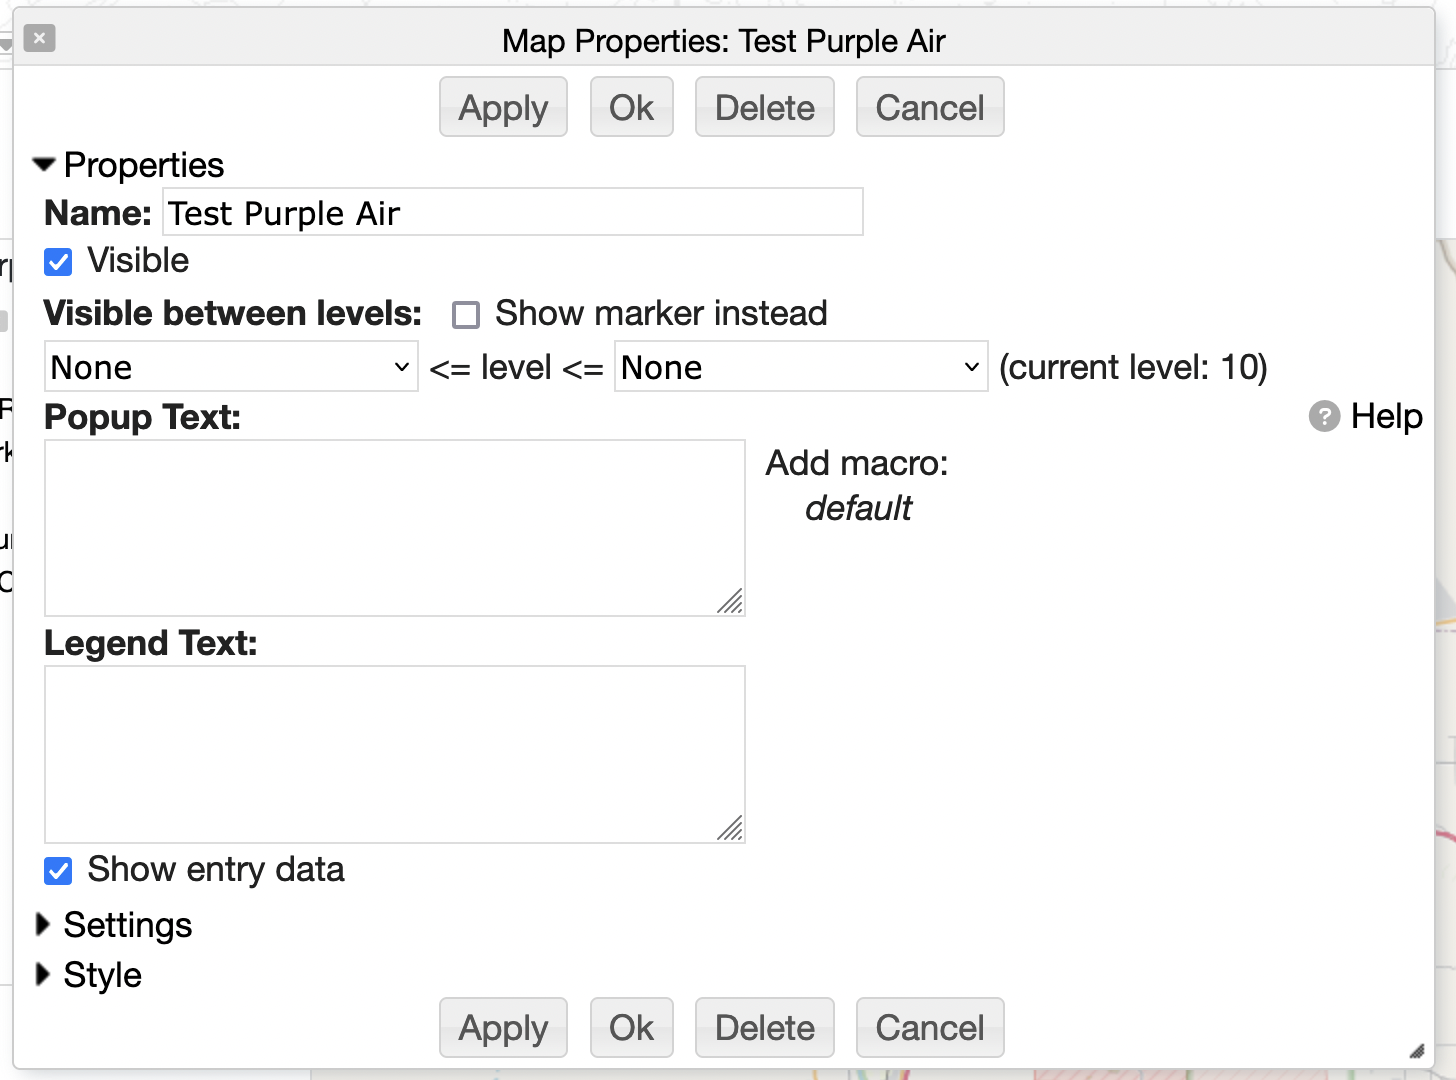
 Click on the settings icon () to bring up the
settings dialog for this multi entry, select "Show entry data" and press OK
Click on the settings icon () to bring up the
settings dialog for this multi entry, select "Show entry data" and press OK
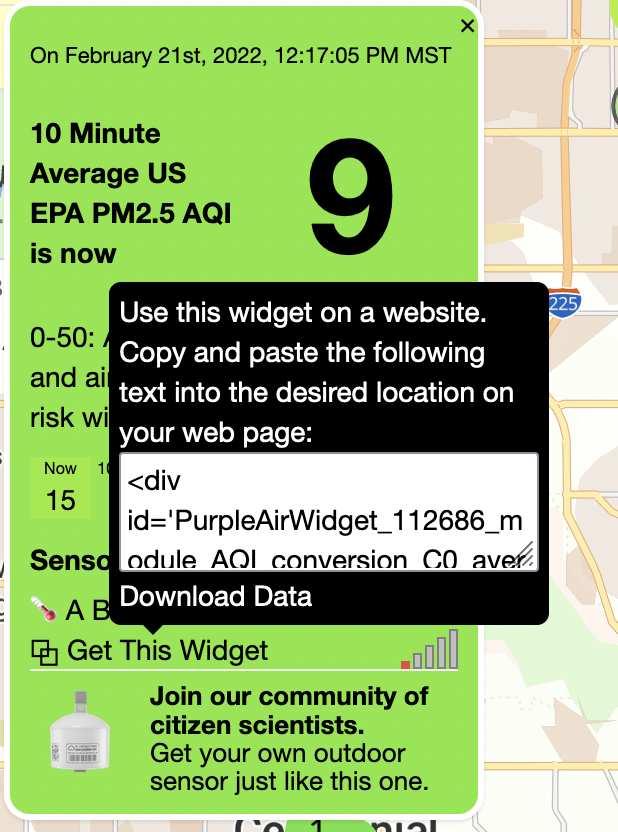
 The Purple Air entries in the map will now show a color-coded circle with the
latest PM2.5 measure:
The Purple Air entries in the map will now show a color-coded circle with the
latest PM2.5 measure:
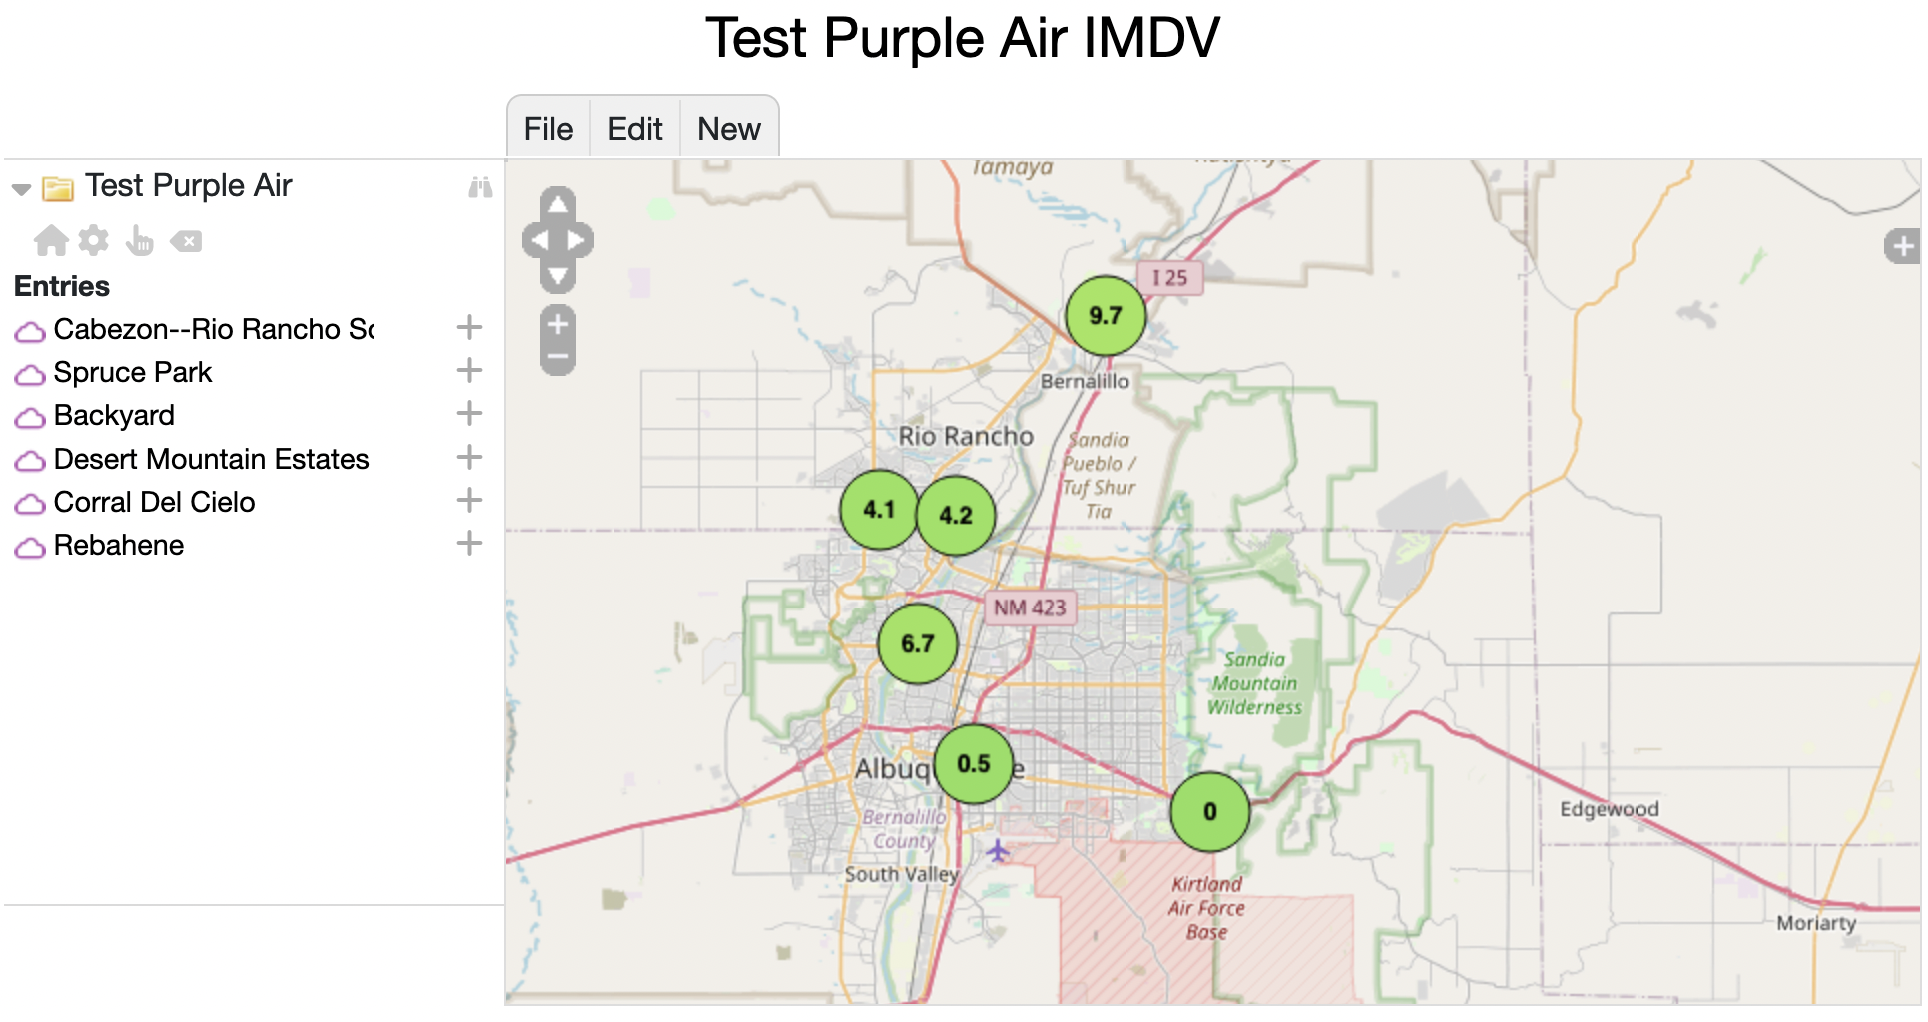 You can also annotate the IMDV map and add other instruments, map layers, etc.
For example, below shows a number of individual Purple Air sensors and CR1000 data logger entries. These are created with the New-&>Entry Marker menu.
You can also annotate the IMDV map and add other instruments, map layers, etc.
For example, below shows a number of individual Purple Air sensors and CR1000 data logger entries. These are created with the New-&>Entry Marker menu.
 The color bar at the bottom is created with wiki text in the Footer property for the IMDV map.
Open the main Properties dialog with IMDV File->Properties menu.
Add the below wiki text to the Bottom Wiki Text field:
The color bar at the bottom is created with wiki text in the Footer property for the IMDV map.
Open the main Properties dialog with IMDV File->Properties menu.
Add the below wiki text to the Bottom Wiki Text field:
 Oglala Lakota College License