The Canvas display and the
IMDV display
both make use of a Canvas Glyph mechanism that provides a declarative specification
for making some drawing in an HTML canvas and its subsequent display.
|
<glyph type>,attr1=value1,attr2=value2,...
<glyph type>,...
...
<glyph type>,...
Where the type can be one of label, circle, rect, image, gauge, 3dbar, axis,tile, vector. e.g.:
3dbar,pos:sw,dx:10,dy:-5,height:100,width:8,baseHeight:5,sizeBy:atmos_temp,sizeByMin:0,sizeByMax:50
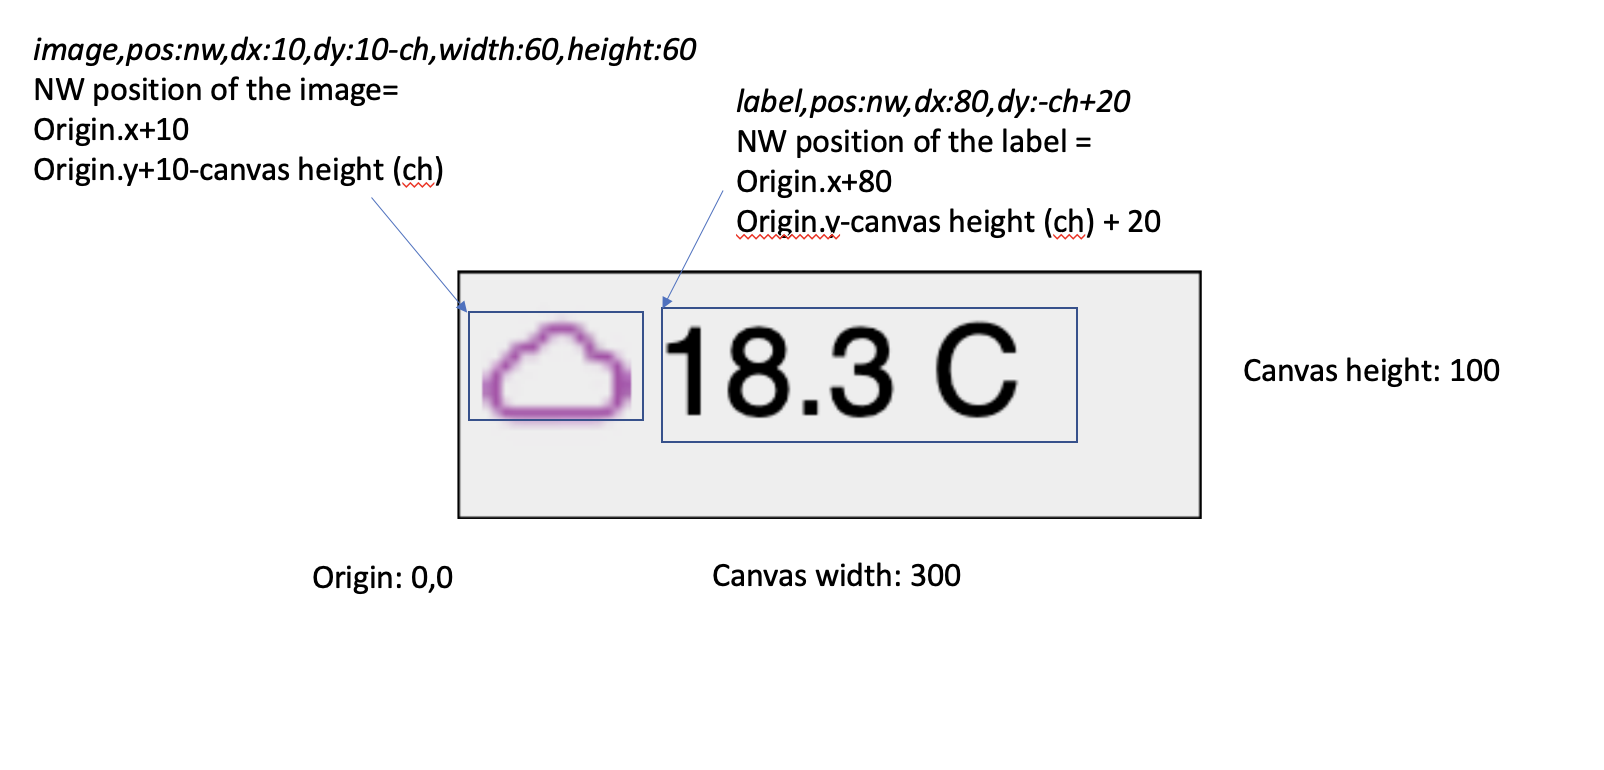
label,font:6pt,pos:ne,dx:90,dy:-90,label:Temp: ${atmos_temp}
{{display_canvas canvasWidth=100 canvasHeight=100}}
Each of these glyphs is positioned within the canvas based on the attributes for the glyph.
label,pos:c,dx:cw2,dy:ch2,label:Some labelIf you want to have a label that is position in the upper right of a canvas of width and height 100. To do this specify the following. The dy=-90 takes into account the approximate height of the text block.
label,pos:ne,dx:100,dy:-90,label:Some label
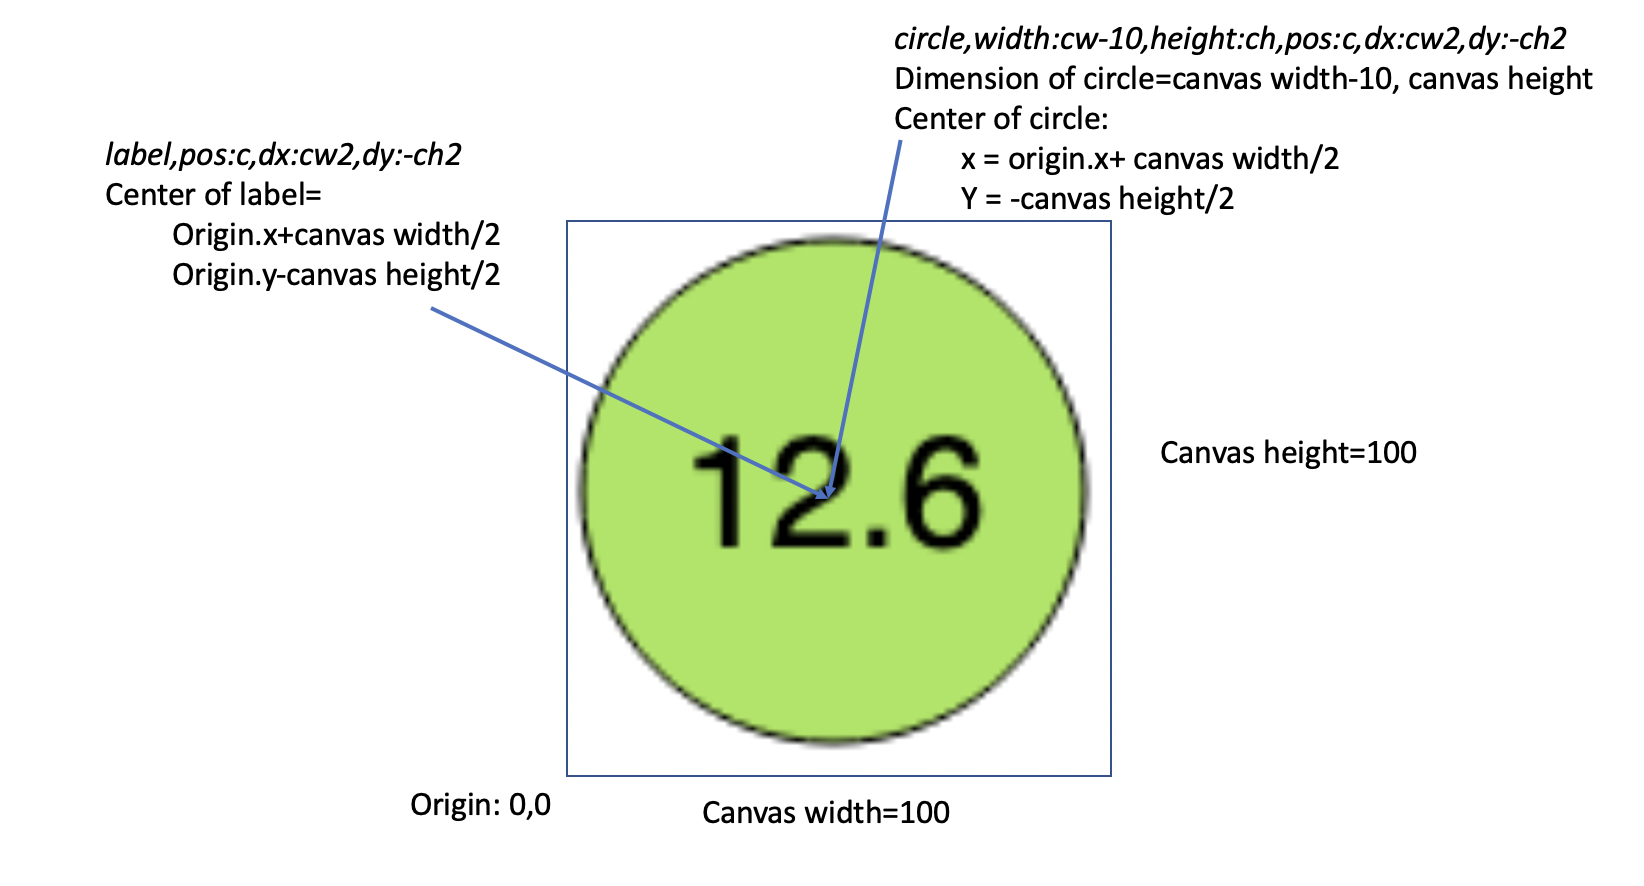
fontSize:0px,iconSize:20,canvasWidth:100,canvasHeight:100,font:28px sans-serif,defaultField:pm2.5And Glyphs:
label,pos:c,dx:cw2,dy:-ch2,label:${${_field}}

#The circle is colored by the selected field with the given color table and min/max range
circle,width:cw-10,height:ch,pos:c,dx:cw2,dy:-ch2,colorBy:${_field},colorTable:airquality,colorByMin:0,colorByMax:300
The positioning is as follows:
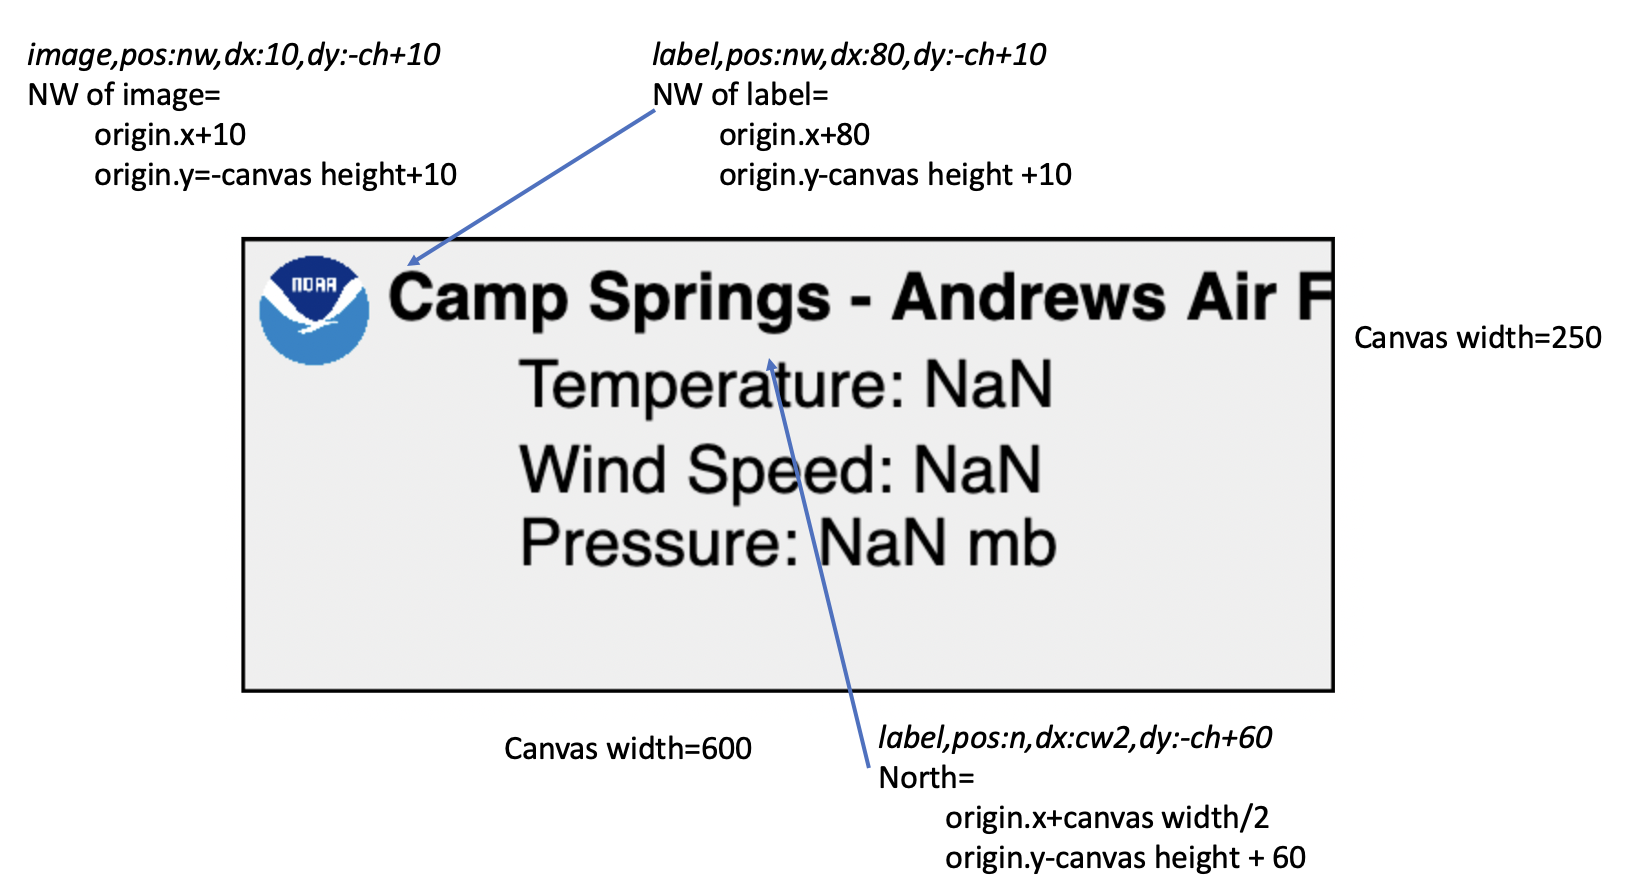
iconSize:75,canvasWidth:600,canvasHeight:250,fill:#efefef,borderWidth:2,borderColor:#000,font:bold 36px sans-serifWith Glyphs defined as:
image,pos:nw,dx:10,dy:-ch+10,width:60,height:60,url:/repository/point/noaalarge.png
label,pady:5,pos:nw,dx:80,dy:-ch+10,label:${entryname}
label,pady:10,pos:n,dx:cw2,dy:-ch+60,font:36px sans-serif,label:${temperature prefixLabel=true}
${windspeed prefixLabel=true}
Pressure: ${barometricpressure scale=0.01 decimals=1} mb
Here there are 2 labels - the name of the entry and a 3 new line separated field values.
This gives:
glyph1="<glyph type>,..."
glyph2="<glyph type>,..."
...
glyphN="<glyph type>,..."
e.g.:
glyph1="3dbar,pos:sw,dx:10,dy:-5,height:100,width:8,baseHeight:5,sizeBy:atmos_temp,sizeByMin:0,sizeByMax:50"
glyph2="label,font:6pt,pos:ne,dx:90,dy:-90,label:Temp: ${atmos_temp}"
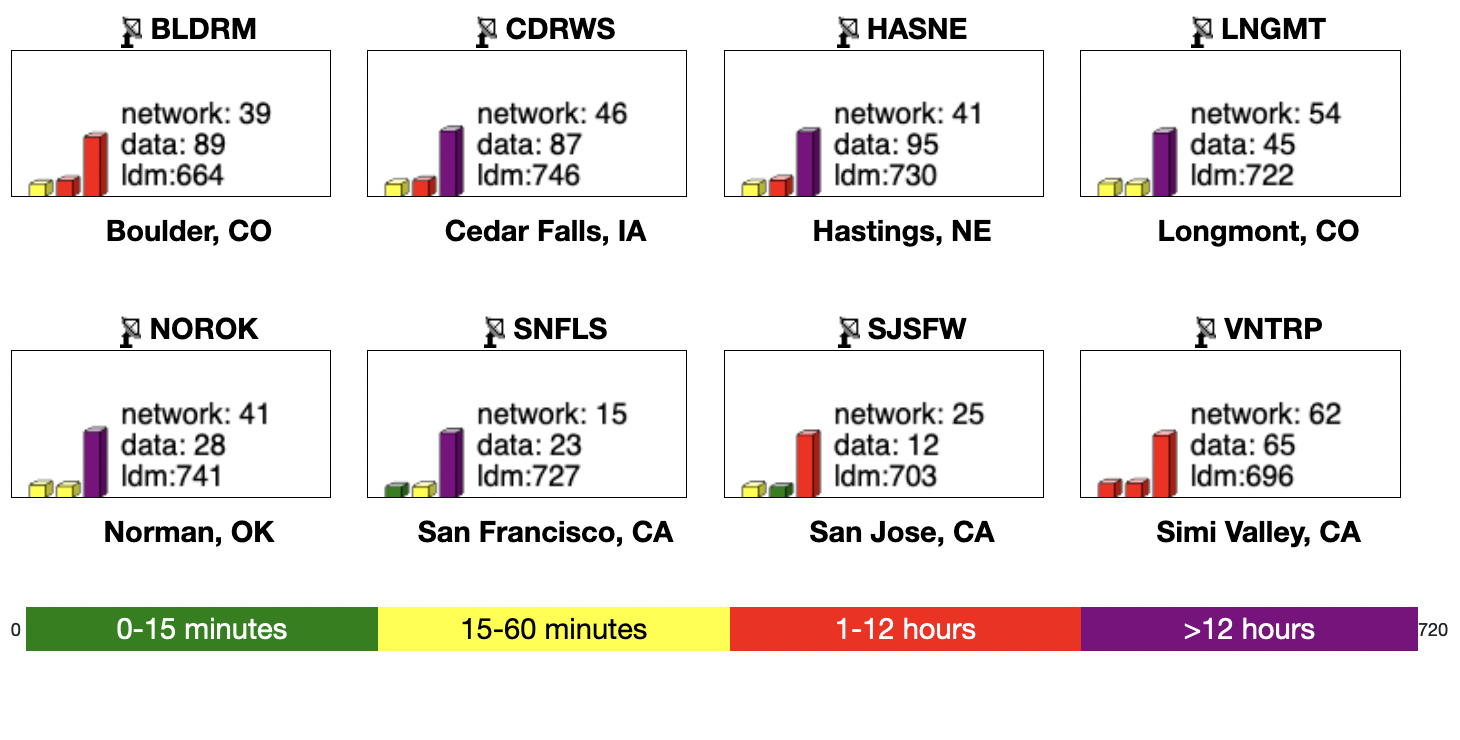
For example, below is a canvas display that shows network statistics for a set of instruments.
...
#Ranges for the color table
colorByMin="0" colorByMax="720"
#define the canvas dimensions
canvasWidth=175 canvasHeight=80
#The sw corner of the label is origin.x+60, origin.y-10
#the _colon_ is replace with ":"
glyph1="label,pos:sw,dy:-10,dx:60,label:network_colon_ ${network_minutes}
data_colon_ ${data_minutes}
ldm:${ldm_minutes}"
#The sw corner of the first bar is origin.x+10 origin.y
#The 3dbar has a width of 8 and a minimum height of 5
#The height of the bar is sizeBy percentage*30
glyph2="3dbar,pos:sw,dx:10,dy:0,height:30,width:8,baseHeight:5,sizeBy:network_minutes,colorBy:network_minutes"
glyph3="3dbar,pos:sw,dx:25,dy:0,height:30,width:8,baseHeight:5,sizeBy:data_minutes,colorBy:data_minutes"
glyph4="3dbar,pos:sw,dx:40,dy:0,height:30,width:8,baseHeight:5,sizeBy:ldm_minutes,colorBy:ldm_minutes"
...
 Oglala Lakota College License