A map that shows georeferenced point data. This can be integrated with other displays, e.g., clicking on a point will highlight that location in
a line chart.
- If a Geojson or Kml layer is specified then the layer is displayed instead of the points. The location of each point is used to
find a containing map feature. That map feature is then colored as defined below.
- pruneFeatures. If set to true than any map feature that does not have a corresponding point will not be shown.
r
- The colorBy attribute specifies the field that is used to color the points or the map segments.
The colorTable attribute specifies a color table to
use and the colorByMin and colorByMax attributes are option and are used to define a color range.
- The centerOnFilterChange will cause the map to recenter when the data is subset from the selection filters.
- The displayDiv, when specified, is the id of a div tag that the map will display the details of
a point or map segment as the user mouses over it. The {displayDiv="mapDisplay${entryid}"} macro
allows one to specify a unique div id for pages that may have multiple map displays. The div looks like:
{
<div id="mapDisplay{{entryid}}" style="max-height:500px;"></div>
}
There is a full example shown below.
{{display_map width="100%"  height="400"
geojsonLayer="entry id of a geojson file"
geojsonLayerName="Layer name"
kmlLayer="entry id of a kml file"
kmlLayerName="Layer name"
pruneFeatures="true"
colorBy="total_ballots"
colorTable="inversegrayscale"
colorByMin="min value"
colorByMax="max value"
displayDiv="mapDisplay${entryid}"}}
Example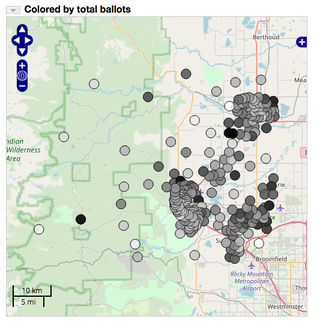 Image 1: Map
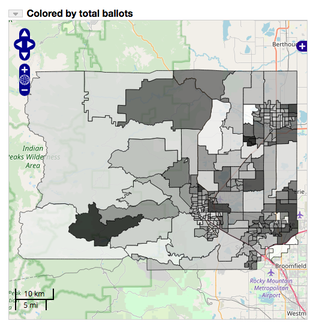 Image 2: Chloropleth Map
This is the wiki text used in the above example:
:heading Map
+row
+col-md-6
{{display_map column="1"  width="-100" height="500"   includeData="false"   showTitle="false"
title="Colored by total ballots"
geojsonLayer="7c8f5e25-e569-4ca9-b389-5bb03cdb138b"
geojsonLayerName="Precincts"
displayAsMap="true"
pruneFeatures="true"
colorBy="total_ballots"
colorBar="inversegrayscale"
displayDiv="mapDisplay${entryid}"
}}
-col
+col-6


:heading Map Details

-col
-row
The map display can be configured to provide a time-based animation of the points with the following attributes.
doAnimation="true" - enable animation
animationShowSlider="true" - show the slider
animationDateFormat="yyyyMMdd" or "yyyy" - default is the fully formatted date
animationMode="cumulative" or "sliding" - how the time window is moved
animationSteps="60"   - how many steps
animationWindow="year" or "month" or "day" or "hour" or "minute" or "second"  - override the animationSteps
animationSpeed="250" - time in milliseconds between each step
You can display text labels at each point with the following attributes:
labelTemplate="text template with ${field id} macros. Use _nl_ for new lines"
labelFontColor="#000"
labelFontSize="12px"
labelFontFamily="'Open Sans', Helvetica Neue, Arial, Helvetica, sans-serif"
labelFontWeight="plain"
labelAlign="lb"  //See http://dev.openlayers.org/docs/files/OpenLayers/Feature/Vector-js.html
align is of the form "hv" where h is "l|c|r" (left, center, right)  and v is "t|n|b" (top,middle,bottom)
labelXOffset="0"
labelYOffset="0"
labelOutlineColor="#fff")
labelOutlineWidth="0"
//Define the point radius
radius="4"
//define a field to size by
sizeBy="<field>"
//use a log scale
sizeByLog=true
//Size min/max
sizeByRadiusMin=1
sizeByRadiusMax=15
//Field to color by
colorBy="<field>cnt"
//Color table
colorTable="blue_green_red"
//Or colors
colors="color1,color2,...,colorN"
//Use a log scale
colorByLog=true
//Set the stroke color
strokeColor="#fff0"
//Map string values to colors
colorByMap="value:color,...,value:color"

//These are used in conjunction with a vector map layer
//If true then count the points within each map feature and use that as the color by value
colorByCount=true
//Suffix to show on map click
doCountLabel="clubs"

//If true then prune out the features that don't have any data points in them
pruneFeatures="true"
Define different shapes to display in the map.
//Define a different icon to use
pointIcon="/repository/dutchbrothers.png"
//Define a different shape
shape="star|cross|x|square|triangle|circle|lightning|rectangle|church"
//Map values to shape
shapeBy=<field>
shapeByMap="value1:shape1,...,valueN:shapeN"

 Oglala Lakota College License